splunk-hec-logging
Summary#
Name#
The splunk-hec-logging plugin is used to forward the request log of Apache APISIX to Splunk HTTP Event Collector (HEC) for analysis and storage. After the plugin is enabled, Apache APISIX will obtain request context information in Log Phase serialize it into Splunk Event Data format and submit it to the batch queue. When the maximum processing capacity of each batch of the batch processing queue or the maximum time to refresh the buffer is triggered, the data in the queue will be submitted to Splunk HEC.
For more info on Batch-Processor in Apache APISIX please refer to: Batch-Processor
Attributes#
| Name | Requirement | Default | Description |
|---|---|---|---|
| endpoint | required | Splunk HEC endpoint configuration info | |
| endpoint.uri | required | Splunk HEC event collector API | |
| endpoint.token | required | Splunk HEC authentication token | |
| endpoint.channel | optional | Splunk HEC send data channel identifier, refer to: About HTTP Event Collector Indexer Acknowledgment | |
| endpoint.timeout | optional | 10 | Splunk HEC send data timeout, time unit: (seconds) |
| ssl_verify | optional | true | enable SSL verification, option as per OpenResty docs |
| max_retry_count | optional | 0 | max number of retries before removing from the processing pipe line |
| retry_delay | optional | 1 | number of seconds the process execution should be delayed if the execution fails |
| buffer_duration | optional | 60 | max age in seconds of the oldest entry in a batch before the batch must be processed |
| inactive_timeout | optional | 5 | max age in seconds when the buffer will be flushed if inactive |
| batch_max_size | optional | 1000 | max size of each batch |
How To Enable#
The following is an example of how to enable the splunk-hec-logging for a specific route.
Full configuration#
curl http://127.0.0.1:9080/apisix/admin/routes/1 -H 'X-API-KEY: edd1c9f034335f136f87ad84b625c8f1' -X PUT -d '
{
    "plugins":{
        "splunk-hec-logging":{
            "endpoint":{
                "uri":"http://127.0.0.1:8088/services/collector",
                "token":"BD274822-96AA-4DA6-90EC-18940FB2414C",
                "channel":"FE0ECFAD-13D5-401B-847D-77833BD77131",
                "timeout":60
            },
            "buffer_duration":60,
            "max_retry_count":0,
            "retry_delay":1,
            "inactive_timeout":2,
            "batch_max_size":10
        }
    },
    "upstream":{
        "type":"roundrobin",
        "nodes":{
            "127.0.0.1:1980":1
        }
    },
    "uri":"/splunk.do"
}'
Minimize configuration#
curl http://127.0.0.1:9080/apisix/admin/routes/1 -H 'X-API-KEY: edd1c9f034335f136f87ad84b625c8f1' -X PUT -d '
{
    "plugins":{
        "splunk-hec-logging":{
            "endpoint":{
                "uri":"http://127.0.0.1:8088/services/collector",
                "token":"BD274822-96AA-4DA6-90EC-18940FB2414C"
            }
        }
    },
    "upstream":{
        "type":"roundrobin",
        "nodes":{
            "127.0.0.1:1980":1
        }
    },
    "uri":"/splunk.do"
}'
Test Plugin#
- Send request to route configured with the
splunk-hec-loggingplugin
$ curl -i http://127.0.0.1:9080/splunk.do?q=hello
HTTP/1.1 200 OK
...
hello, world
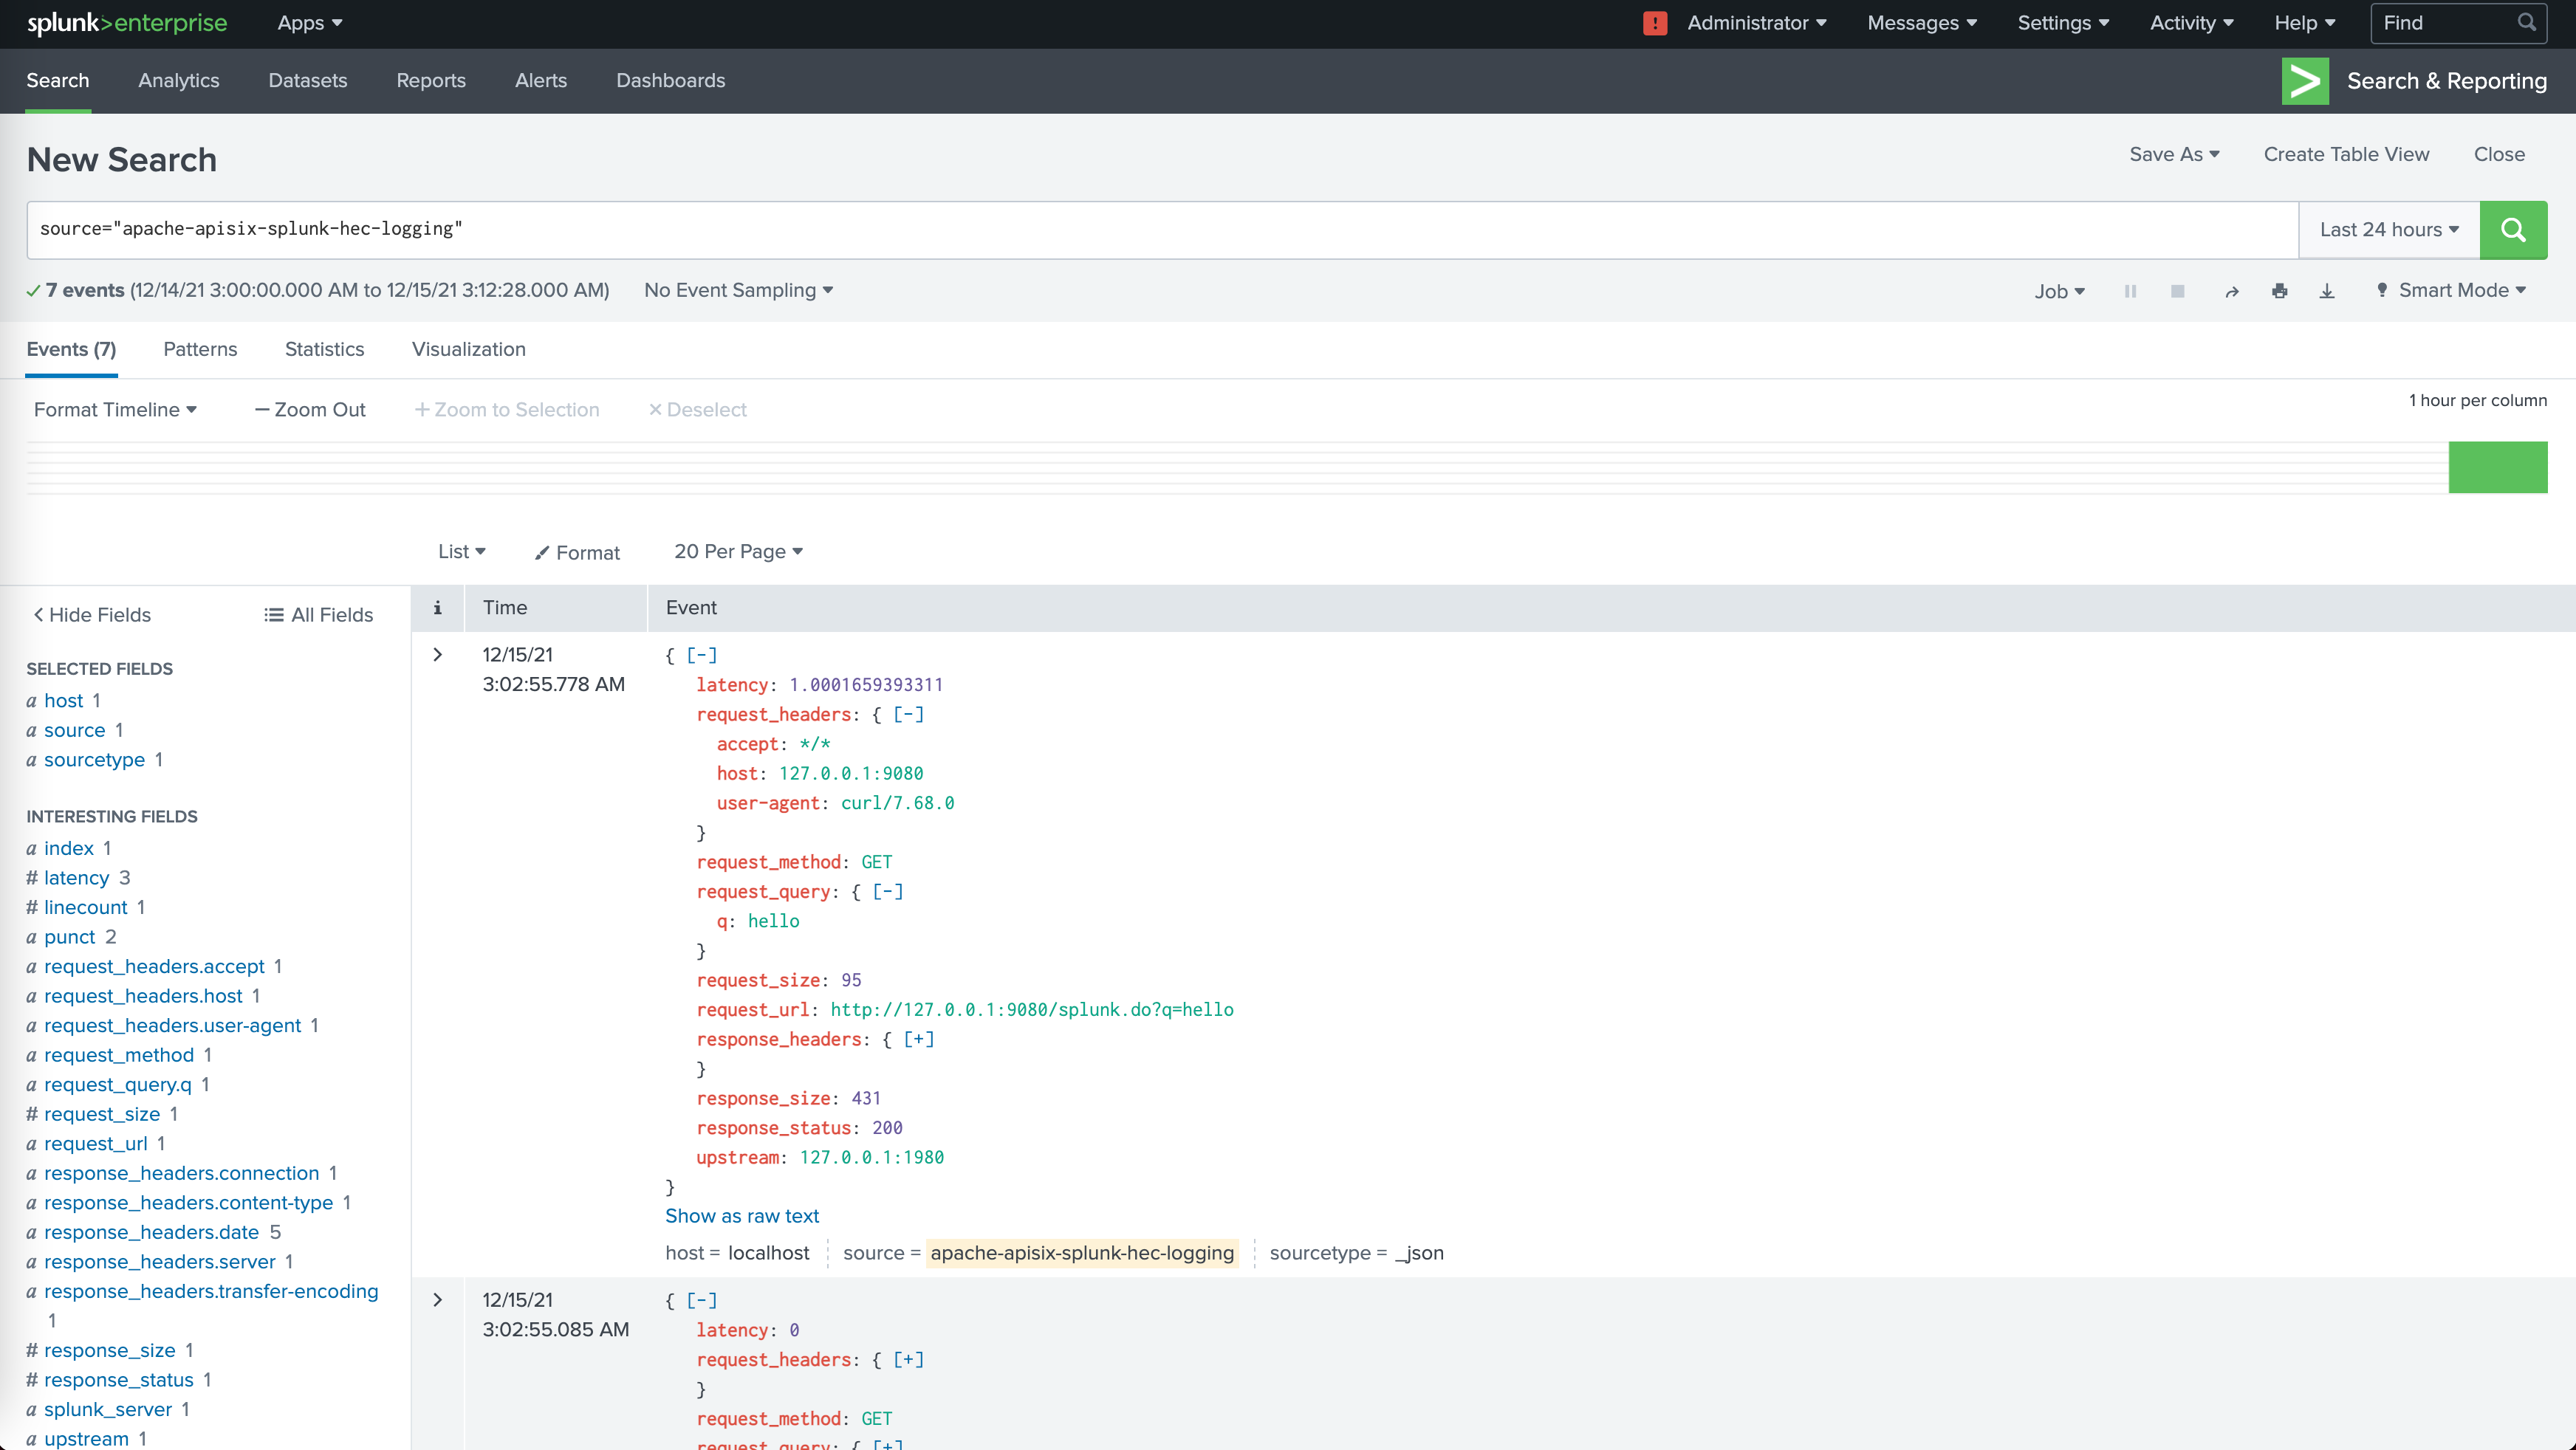
- Login to Splunk Dashboard to search and view
Disable Plugin#
Disabling the splunk-hec-logging plugin is very simple, just remove the JSON configuration corresponding to splunk-hec-logging.
$ curl http://127.0.0.1:9080/apisix/admin/routes/1 -H 'X-API-KEY: edd1c9f034335f136f87ad84b625c8f1' -X PUT -d '
{
    "uri": "/hello",
    "plugins": {},
    "upstream": {
        "type": "roundrobin",
        "nodes": {
            "127.0.0.1:1980": 1
        }
    }
}'